Slide 1

Slide notes: A Line Graph can easily be included in a Report.


Slide 2

Slide notes:


Slide 3

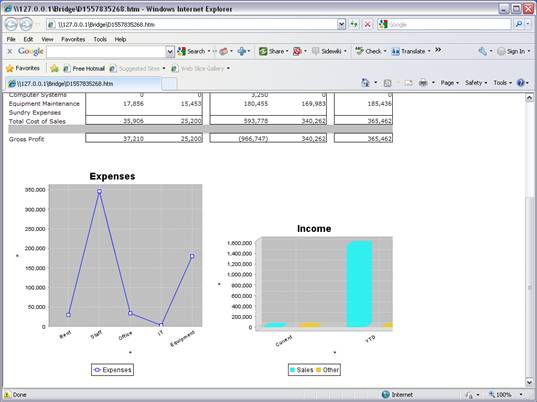
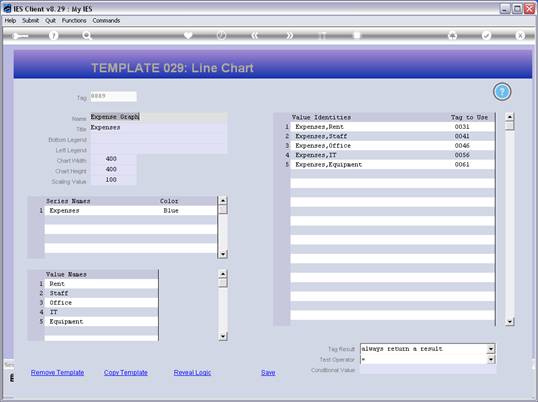
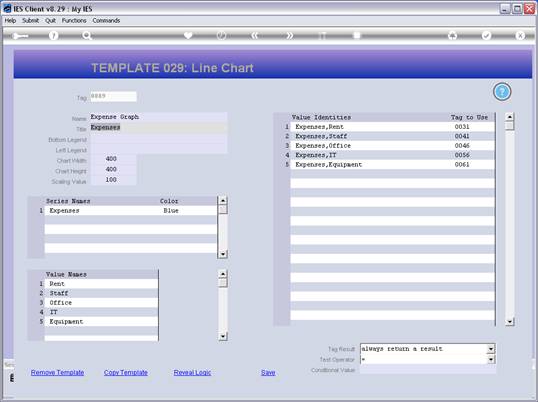
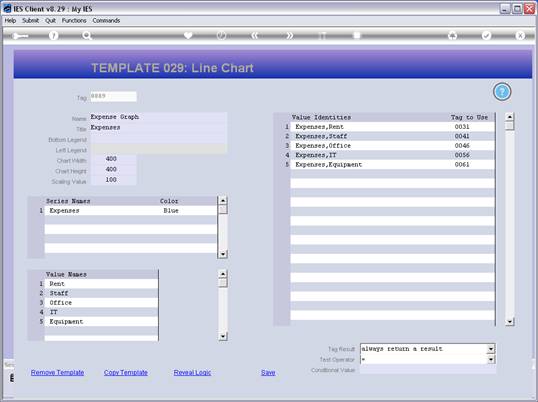
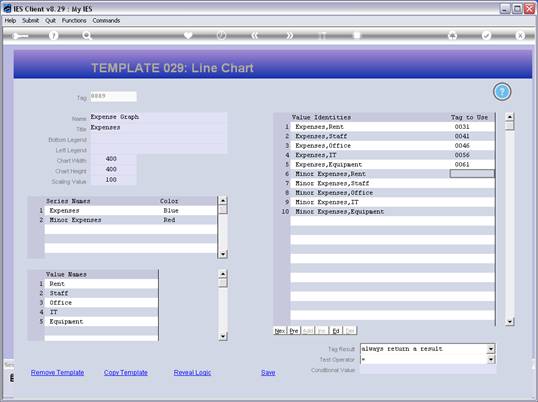
Slide notes: First, we look at the Layout, where the Chart is represented by a single Tag, but the important point to note is the area that has been reserved for the Line Graph display in the 
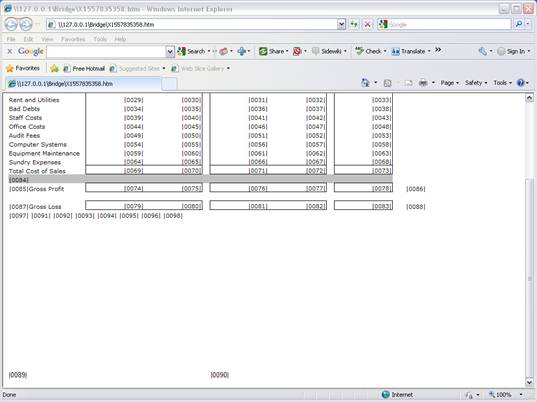
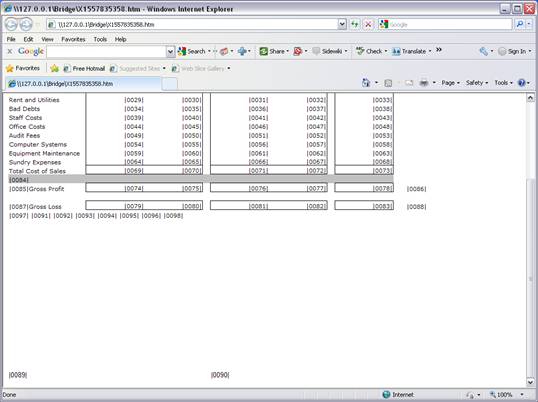
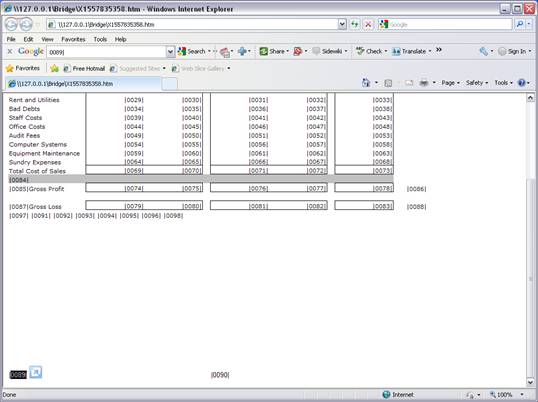
result. It is necessary to provide sufficient space for the Graph, especially when using a spreadsheet to do the layout. In which case we need to combine and merge a number of cells to make the Graph area a single cell space that is adequate in size for the Graph to display properly.


Slide 4

Slide notes:


Slide 5

Slide notes:


Slide 6

Slide notes:


Slide 7

Slide notes:


Slide 8

Slide notes:


Slide 9

Slide notes:


Slide 10

Slide notes: A Line Graph needs a Title, and optionally we may add Bottom and Left Legends.


Slide 11

Slide notes:


Slide 12

Slide notes:


Slide 13

Slide notes: We may also adjust the default Width, Height and Scaling Values.


Slide 14

Slide notes:


Slide 15

Slide notes: The Help explains the required components to display a Line Graph in the Report.


Slide 16

Slide notes:


Slide 17

Slide notes:


Slide 18

Slide notes:


Slide 19

Slide notes: For every Series that we state, there will be another Line in the Line Graph. We need 1 or more Series.


Slide 20

Slide notes: And we also need 1 or more Value Names. A Value Name is a display point for each Series, depending on the Value provided by the designated Tag.


Slide 21

Slide notes: For each Series, the system will create an Identity for each Value Name, and then we need to state where the Value for the Identity will come from, i.e. which Tag.


Slide 22

Slide notes:


Slide 23

Slide notes:


Slide 24

Slide notes:


Slide 25

Slide notes:


Slide 26

Slide notes:


Slide 27

Slide notes:


Slide 28

Slide notes:


Slide 29

Slide notes:


Slide 30

Slide notes:


Slide 31

Slide notes:


Slide 32

Slide notes:


Slide 33

Slide notes:


Slide 34

Slide notes:


Slide 35

Slide notes:


Slide 36

Slide notes:


Slide 37

Slide notes:


Slide 38

Slide notes:


Slide 39

Slide notes:


Slide 40

Slide notes:


Slide 41

Slide notes:


Slide 42

Slide notes:


Slide 43

Slide notes:


Slide 44

Slide notes: The moment we create a new Series or a new Value Name, there will automatically appear new Identities on the right.


Slide 45

Slide notes: And that's how easy it is to do a Line Graph.


Slide 46

Slide notes: As a reminder, we note that when we use Charts in a Report, then the Java Script must NOT be suppressed.


Slide 47

Slide notes: