Slide 1

Slide 
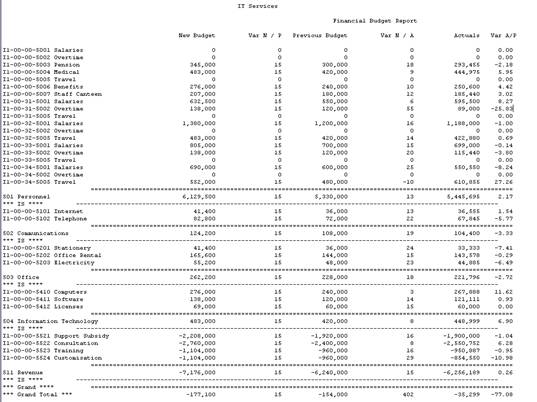
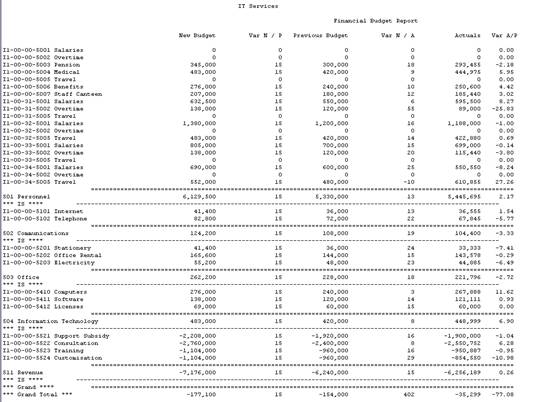
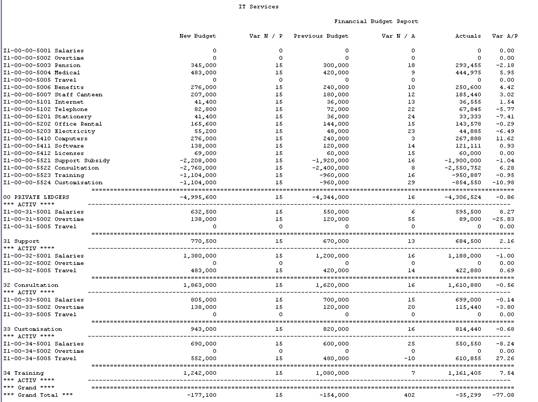
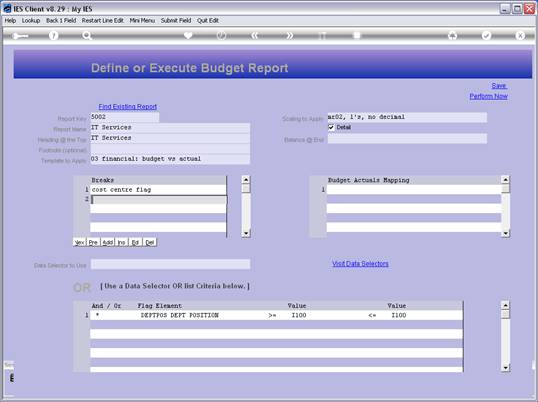
notes: With Budget Writer, if we do not use any Breaks, then we simply get the Accounts listed in order of Account Code, and with a Grand Total at the 
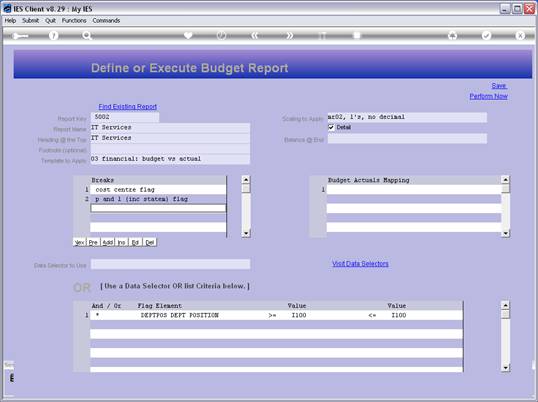
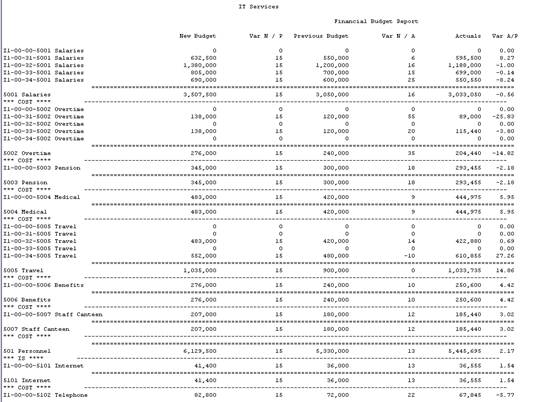
end. When we use Breaks, and we may have up to 3 on a Report, then there is an automatic sorting by the Break type, and with sub totals at each Break. This is quite useful, as we will see now.


Slide 2

Slide notes:


Slide 3

Slide notes: In this Report, we are sorting and breaking on the Profit and Loss group, which we call the ISPOS, short for Income Statement Position. So that means we have a sub total for all Personnel, all Communications, all Office and other groupings.


Slide 4

Slide notes:


Slide 5

Slide notes:


Slide 6

Slide notes:


Slide 7

Slide notes: Towards the end, after all the Expenditure, we have Revenue. Therefore, the Grand Total is  a Profit or Loss total for this Department, and the negative Total is in fact a Profit.


Slide 8

Slide notes:


Slide 9

Slide notes:


Slide 10

Slide notes:


Slide 11

Slide notes:


Slide 12

Slide notes: Next, we change the P&L flag to an Activity flag for the Break, to see what that will do to the Report result.


Slide 13

Slide notes:


Slide 14

Slide notes:


Slide 15

Slide notes: So now we have all the non-activity Accounts, i.e. Activity 00, together.


Slide 16

Slide notes:


Slide 17

Slide notes: Following that, we have all Accounts for Activity Support together with totals, Consultation together with totals, etc.


Slide 18

Slide notes:


Slide 19

Slide notes:


Slide 20

Slide notes:


Slide 21

Slide notes:


Slide 22

Slide notes:


Slide 23

Slide notes:


Slide 24

Slide notes:


Slide 25

Slide notes:


Slide 26

Slide notes:


Slide 27

Slide notes:


Slide 28

Slide notes: We can also have multiple Breaks, so now we will use the Cost Ledger as the 1st Break, followed by the P&L flag.


Slide 29

Slide notes:


Slide 30

Slide notes:


Slide 31

Slide notes: The result for this is that we have all Accounts with the same Cost Centre together, with break totals, and secondly these are all sorted by P&L Flag as well, and with sub totals whenever the P&L Flag changes.


Slide 32

Slide notes:


Slide 33

Slide notes:


Slide 34

Slide notes: So the Breaks work with the GL Chart, and are extremely useful for producing the result that we want for a particular Report.