Slide 1

Slide notes: Business Intelligence, or BI as it is commonly called, includes computer-based techniques that we may use to analyze business data, spot trends or tendencies, and dig out answers to questions about our Business performance.


Slide 2

Slide notes: In the IES Ledger BI, the Accounts Chart provides the  basis for historical information and trends, the basis for predictive views and for answering analytical questions, and the basis for business performance measurement.


Slide 3

Slide notes: Here is an example of a Sales View Set. In any View Set, we can apply Period Settings of our choice, to be dynamically mapped for the answers to be produced.


Slide 4

Slide notes: We can select from a range of available Financial, Physical and Key Performance Indicator perspectives.


Slide 5

Slide notes: And we can select any cut of the Accounts Chart by using the Chart Flags.


Slide 6

Slide notes: When ready to see the result for a selection of parameters, we choose 'Open Ledger View'.


Slide 7

Slide notes: In this example, we can see all the Sales and Cost of Sales results for the various Retail Outlets in this Enterprise, plus the overall net figure.


Slide 8

Slide notes: We can also use a Master Account, which is a pre-selected set of Accounts, to reveal a Master View.


Slide 9

Slide notes: In this case, the Master View will reveal the results for the Downtown Branch.


Slide 10

Slide notes: So here we can see the results for the selected Branch, with total Sales, total Cost of Sales, and Net Sales Revenue.


Slide 11

Slide notes: Super Accounts can construct views of multiple Master Accounts that are presented together.


Slide 12

Slide notes:


Slide 13

Slide notes:


Slide 14

Slide notes: And in this example, we can see all the comparative Sales for the various Branches. Any of the Branches can be drilled for detail of the particular Branch.


Slide 15

Slide notes: Here we have the focus only on the Downtown Branch.


Slide 16

Slide notes:


Slide 17

Slide notes:


Slide 18

Slide notes:


Slide 19

Slide notes:


Slide 20

Slide notes: BI works for any kind of Business. Here is an example in Agriculture, where we look at an Activity called Planting.


Slide 21

Slide notes: The inner view we request is that of Year to Date Physical and Budget, which will reveal the Year to Date Resources applied and compared to the Resources Budget. In other words, rather than looking at the Financials, we are now looking at the Physicals side.


Slide 22

Slide notes: We are including Departments from 700 to 710, and only Activity 55, which is Planting.


Slide 23

Slide notes:


Slide 24

Slide notes: The view reveals that we have applied  more Resources than Budgeted for, on Man Hours and Tractor Hours.


Slide 25

Slide notes:


Slide 26

Slide notes:


Slide 27

Slide notes: While now restricting the perspective only to Department 700, we will home in with another perspective.


Slide 28

Slide notes:


Slide 29

Slide notes:


Slide 30

Slide 
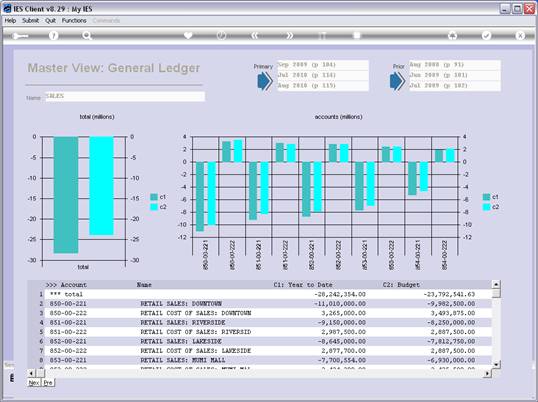
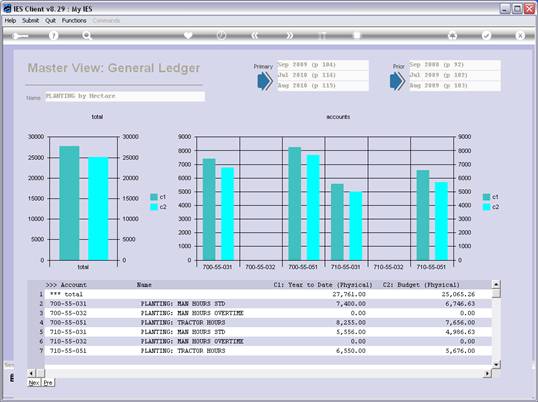
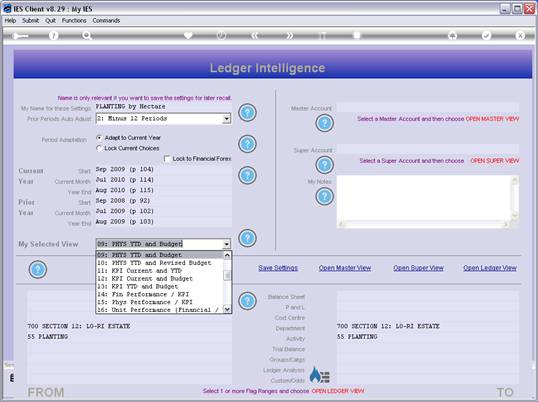
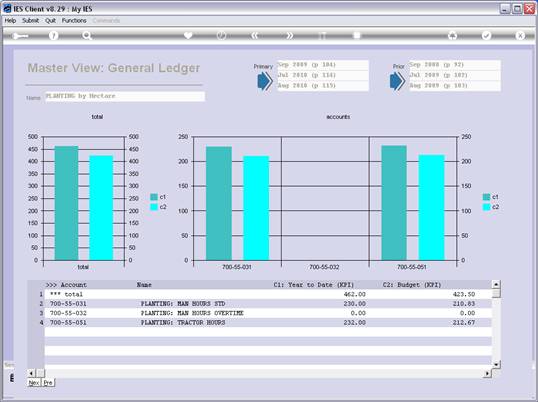
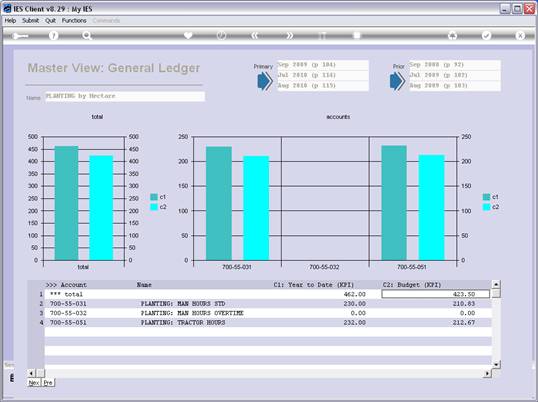
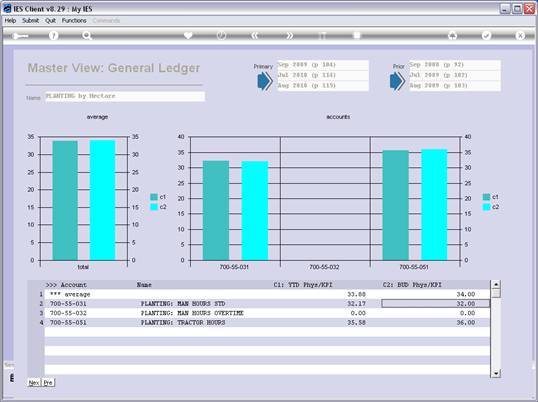
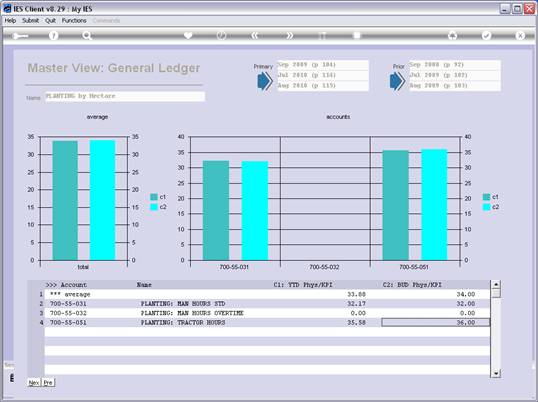
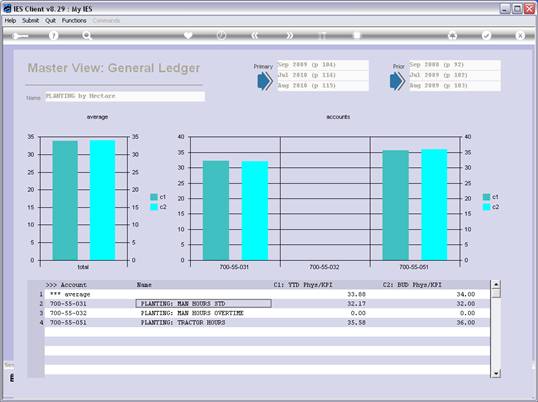
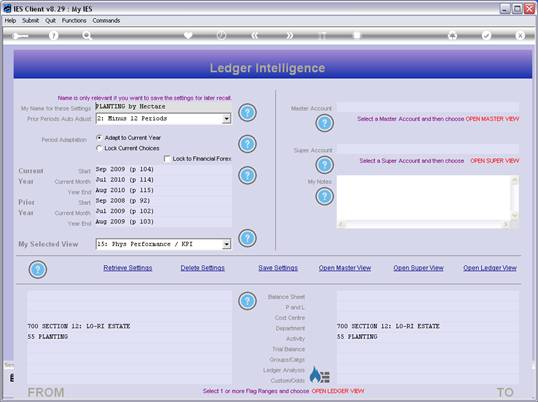
notes: And this time we will compare the Year to Date Key Performance Indicator, which is Hectares, with the Budget. Since we already know that we have applied more Resources, we may now want to see whether we have planted more Hectares than Budgeted, because that would explain the increase in Resources applied.


Slide 31

Slide notes: Sure enough, we can see that we have planted roughly 10% more Hectares than originally budgeted for, and that does explain why we applied more Resources.


Slide 32

Slide notes:


Slide 33

Slide notes:


Slide 34

Slide notes:


Slide 35

Slide notes: Next, we decide to measure the actual performance of Resources applied for the Planting activity in this Section of the Estate.


Slide 36

Slide notes: And the view is re-assuring. For Man Hours, we are marginally above the expected standard, whereas for Tractor Hours, we are marginally below the expected standard. All in all, this is a satisfactory performance.


Slide 37

Slide notes:


Slide 38

Slide notes:


Slide 39

Slide notes: In any event, when we want more detail of the underlying source information, we can drill deeper.


Slide 40

Slide notes: In this case, we can drill directly into the underlying GL Account.


Slide 41

Slide notes: And here, we may drill into Transaction detail or choose any of the available further views at GL level.


Slide 42

Slide notes: The Ledger BI is easy to use, very functional, and able to produce the answers to all kinds of questions we may ask about our Business.