Slide
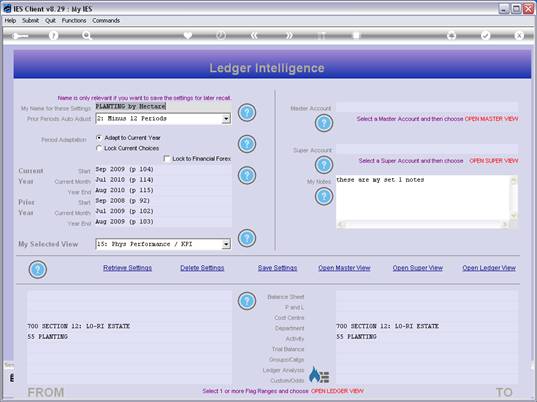
notes: We speak of the View that we select for the comparative results as
the "inner" View within the View, because apart from the various
methods for gathering the Accounts that will be used for the Result, there
are also an entire series of different measurements available. And the
selected measurement is the so-called "inner view".
Slide 2
Slide
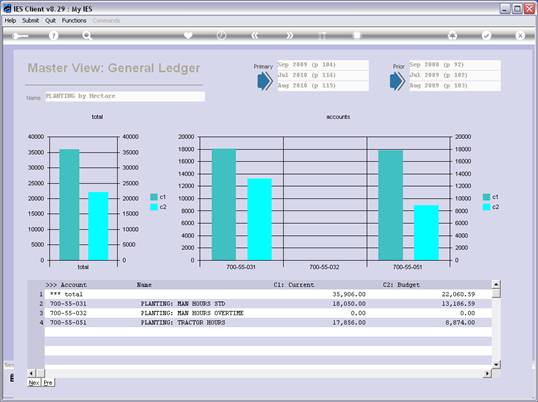
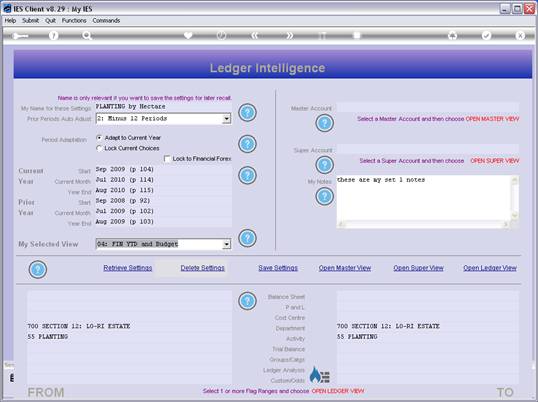
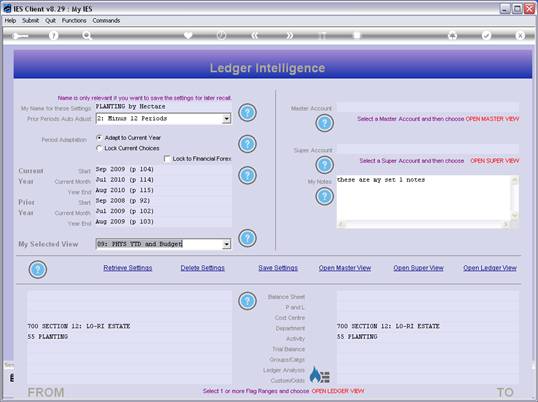
notes: In this example, we are looking at results of Planting on a certain
section of an Estate, which is also called Department 700 in the Chart of
Accounts. From all the Accounts in this Department, we are focusing
specifically on those Accounts that relate to the Planting Activity.
Slide 3
Slide
notes:
Slide 4
Slide
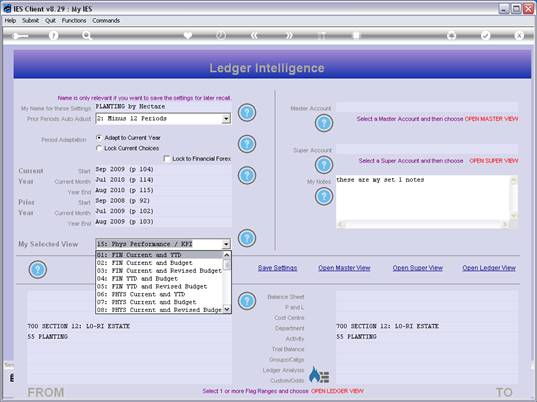
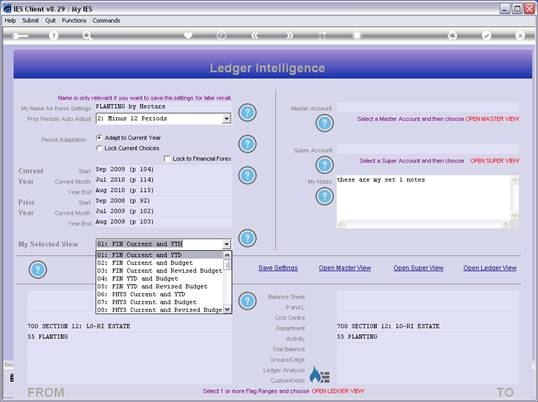
notes: So let us first select the measurement or inner view number 1, which
will reveal Financial results for the selected Current Month and Year to
Date.
Slide 5
Slide
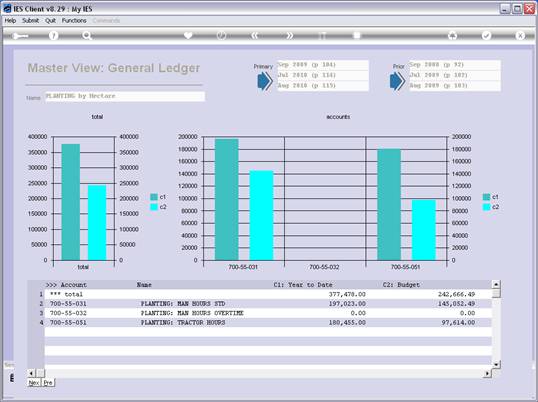
notes: Here is the View.
Slide 6
Slide
notes:
Slide 7
Slide
notes:
Slide 8
Slide
notes:
Slide 9
Slide
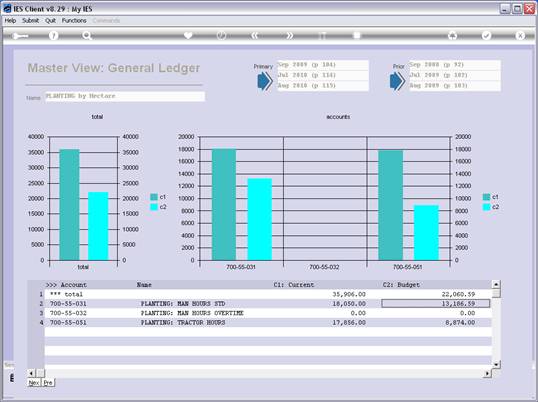
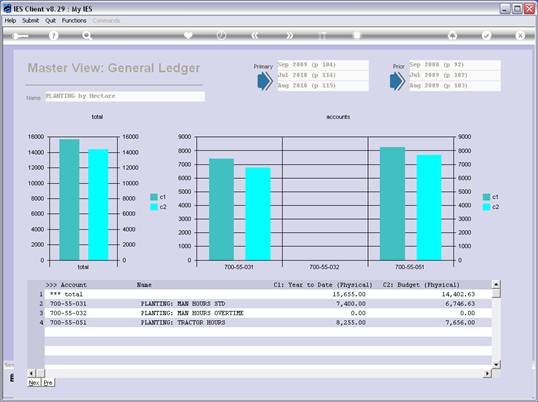
notes: Next, we use View number 2 to reveal the Current Month Financial
performance versus the Financial Budget.
Slide 10
Slide
notes: And theresult is that we are
significantly overspent. We may ask the question why this is so.
Slide 11
Slide
notes:
Slide 12
Slide
notes:
Slide 13
Slide
notes:
Slide 14
Slide
notes:
Slide 15
Slide
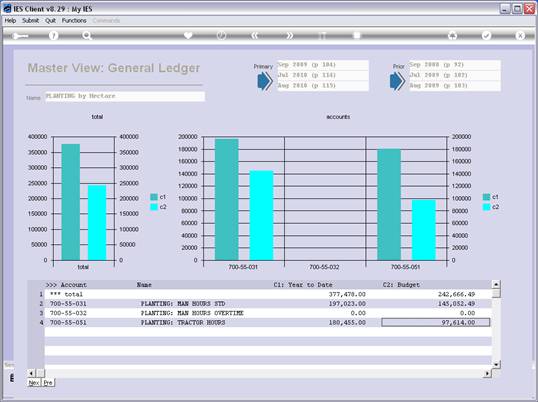
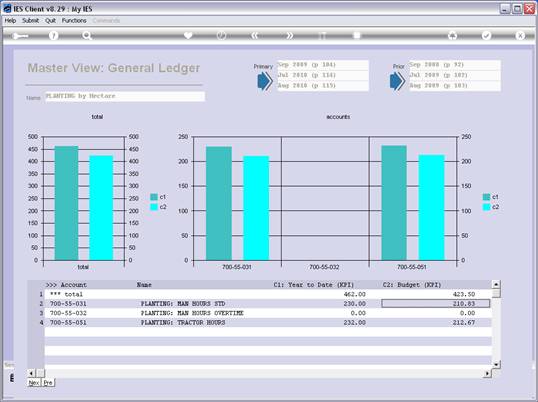
notes: View number 4 will show us what the Year to Date Financial
performance is versus the Budget.
Slide 16
Slide
notes: And here again, we are seriously overspent.
Slide 17
Slide
notes:
Slide 18
Slide
notes:
Slide 19
Slide
notes:
Slide 20
Slide
notes:
Slide 21
Slide
notes:
Slide 22
Slide
notes: So we may ask, what is the Physical performance versus the Budget,
because that will reveal the Management performance on the ground, whereas
the Financial over expenditure may be beyond the Section Manager's control
due to Price escalation over which he has little or no control, but the
Physical performance is certainly within his control.
Slide 23
Slide
notes: And here we see quite a different picture. We are still over Budget,
but only slightly, and nothing like on the Financial level. So that is
interesting, and begs the question whether perhaps we have Planted more
than planned?
Slide 24
Slide
notes:
Slide 25
Slide
notes:
Slide 26
Slide
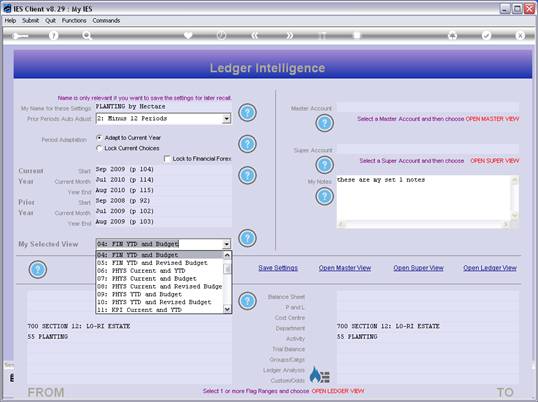
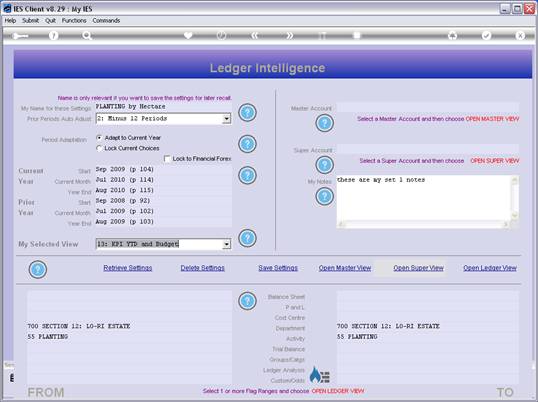
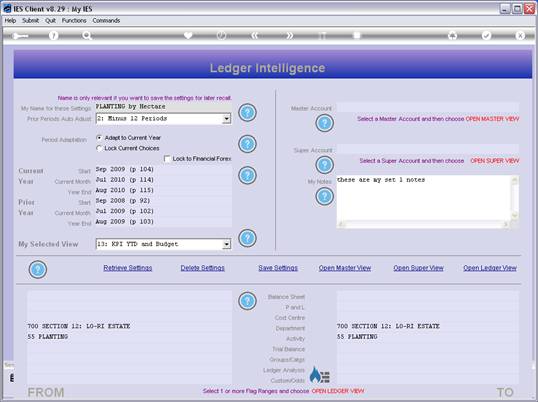
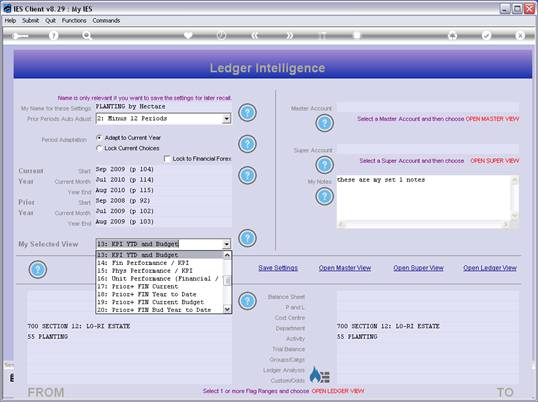
notes: So next we choose view number 13, which will reveal the Year to Date
Key Performance Indicator versus Budget. In other words, we will be able to
find out how many Hectares we have Budgeted to Plant, and how many we have
actually planted.
Slide 27
Slide
notes: Sure, the answer is that we have planted roughly 20% more Hectares
than originally Budgeted for, hence the Physical being slightly over
Budget. As such, there must be another reason why the Financial is so
heavily overspent, and we can already deduce that it is not related to the
Physical performance, but to some other reason.
Slide 28
Slide
notes:
Slide 29
Slide
notes:
Slide 30
Slide
notes:
Slide 31
Slide
notes:
Slide 32
Slide
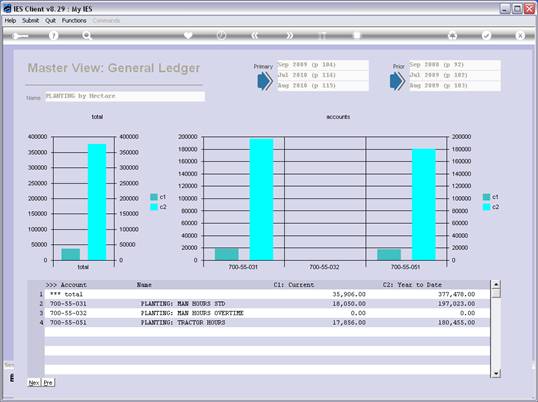
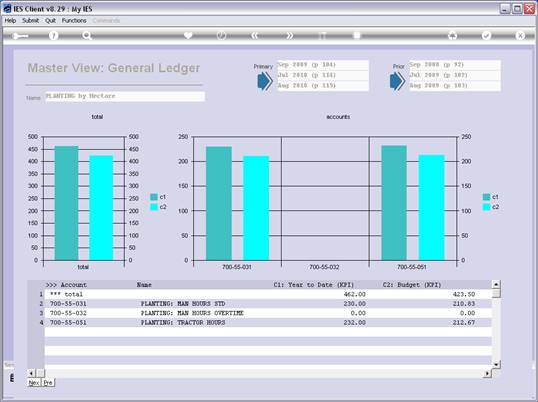
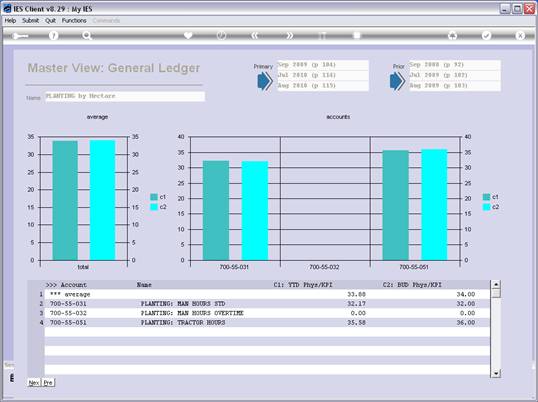
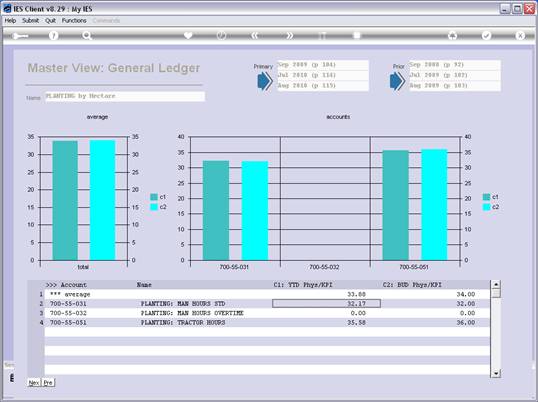
notes: To double-check the Physical Performance, we choose view 15, which
will reveal the Physical Performance over KPI.
Slide 33
Slide
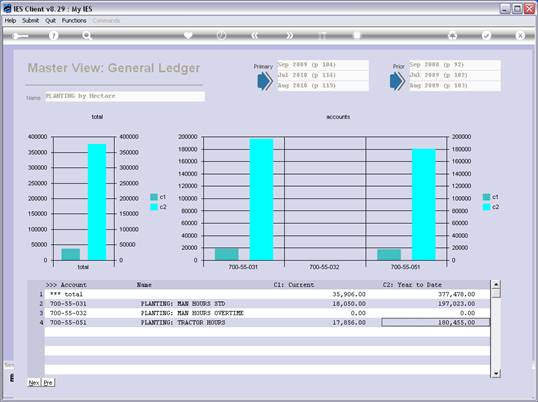
notes: The result, as we can see, is good. It means that the standard
number of Man Hours per Hectare planted is only slightly exceeded, and the
Tractor Hours applied per Hectare planted is below the standard, hence an
excellent performance.
Slide 34
Slide
notes:
Slide 35
Slide
notes: And so, as we can see from this example, we can use the Measurement
Views productively to find the answers we want about our Business, whatever
kind of Business it is. Our example here has been Agriculture, but the same
principles can be applied in any Business, with the Business Intelligence
tools that we have here.